May 10, 2026
Same Data, Different Plots — Which One Is Correct?
Structural Dynamics Series #3
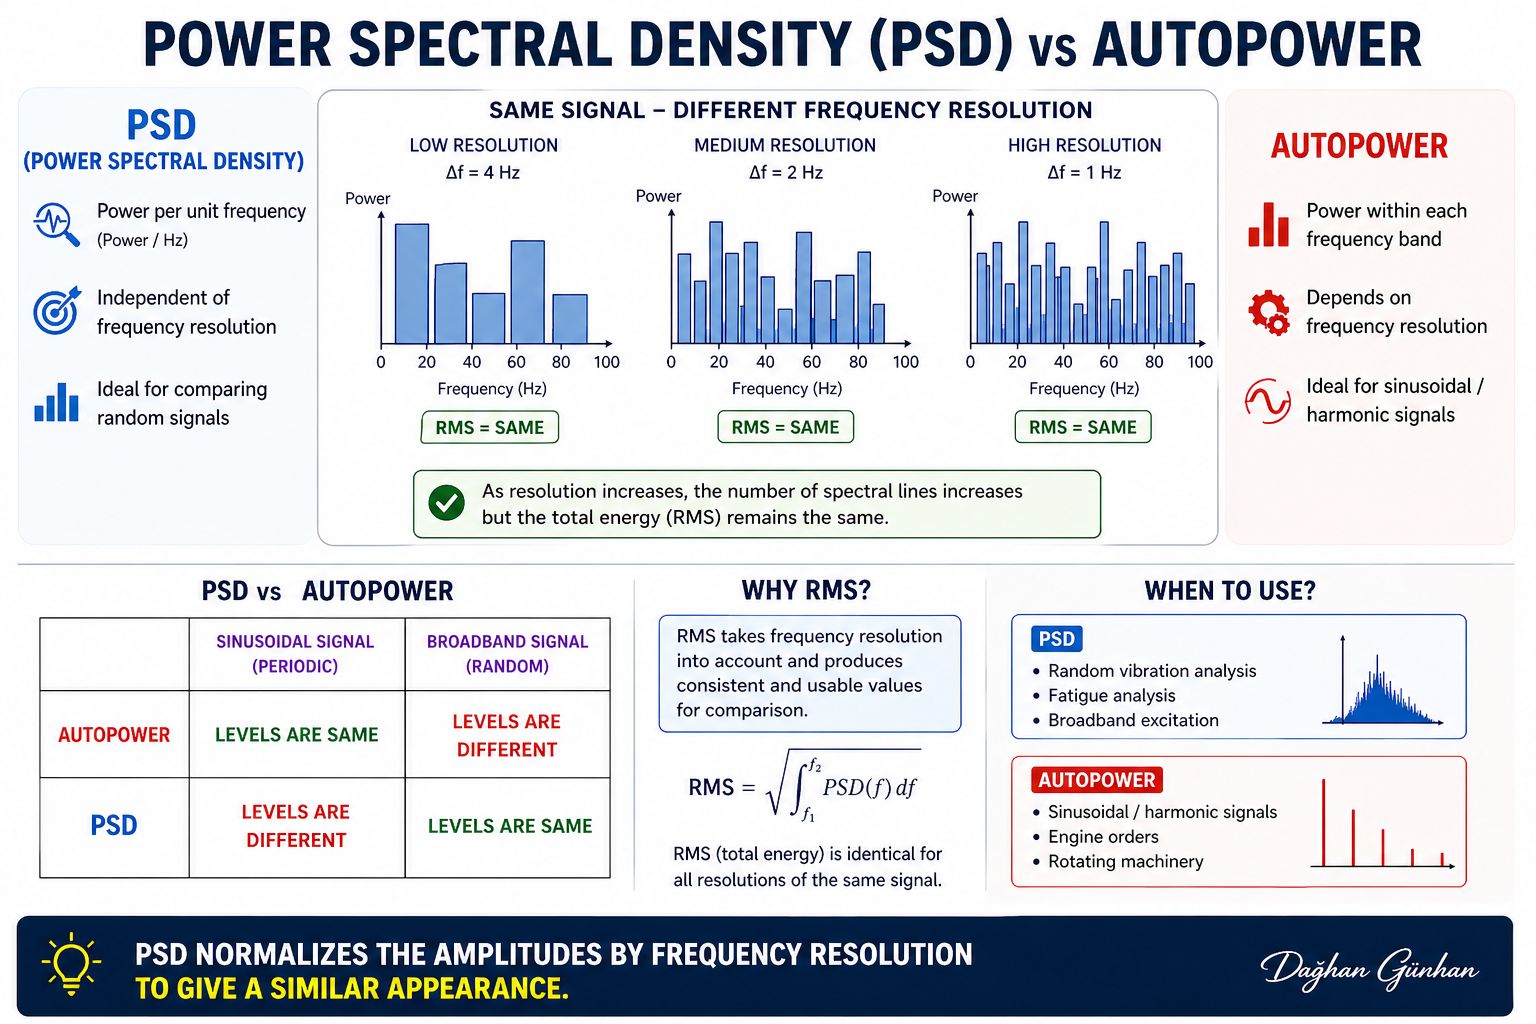
One of the key points to consider in vibration analysis: should you evaluate your signal using PSD or Autopower?
What is PSD?
Power Spectral Density (PSD) represents the signal's power per unit frequency. Meaning it's independent of frequency resolution and enables consistent comparison between different measurements.
What is Autopower?
Autopower represents the energy within each frequency band. However, it depends on frequency resolution.
The critical point
For the same signal, if frequency resolution changes, the number of spectral lines changes, and the amplitudes change. But the total energy (RMS) remains the same.
RMS (Root Mean Square) is a statistical measure representing the total energy content of a vibration signal — in simple terms, it reflects the effective value of a complex vibration signal over time.
When to use which
- PSD → random vibration, fatigue analysis
- Autopower → sinusoidal / harmonic signals
Important note
Looking only at PSD, Autopower curves, or comparing GRMS values is not sufficient to conclude which vibration profile is more critical for your system. These results should always be evaluated together with natural frequencies, modal participation factors, and FRFs (Frequency Response Functions).
Originally posted on LinkedIn.